
文檔:IQ curve.svg

此 SVG 檔案的 PNG 預覽的大小:600 × 480 像素。 其他分辨率:300 × 240 像素 | 960 × 768 像素 | 1,280 × 1,024 像素 | 2,560 × 2,048 像素。
原始文件 (SVG檔案,表面大細: 600 × 480 像素,檔案大細:9 KB)
摘要
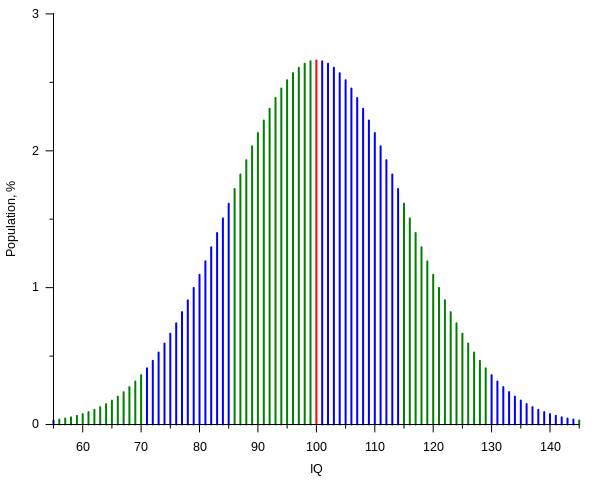
| 簡話 | Current IQ tests typically have standard scores such that the mean score is 100 with each standard deviation from the mean counting for 15 IQ points.[1] The plot shows, assuming that such scores have a normal distribution, the percentage of people getting a score versus the score itself, from 55 to 145 IQ, that is over a span of six standard deviations. Spans are represented with different colors for each standard deviation above or below the mean. The plot was created with the following gnuplot code: |
| SVG開發 | |
| 原始碼 | Gnuplot codeset terminal svg name 'IQ_curve' size 600,480 font ',10' rounded
set output 'IQ_curve.svg'
mu = 100.0
sigma = 15.0
from = 55
to = 145
# Normal distribution:
# (continuos normalization approximation, good to ~10 digits in this case)
P(x) = exp(-(x - mu)**2 / (2 * sigma**2)) / (sqrt(2 * pi) * sigma) * 100
# By sigma intervals:
oddsi(x) = (int(abs(x - mu) / sigma) % 2) ^ (x < mu)
Pm(x) = (x == mu) ? P(x) : 1/0 # sample at mu
Po(x) = ( oddsi(x) && (x != mu)) ? P(x) : 1/0 # samples in odd sigma intervals
Pe(x) = (!oddsi(x) && (x != mu)) ? P(x) : 1/0 # samples in even sigma intervals
set key off
set border 3
set xlabel 'IQ'
set xtics 10 out nomirror
set mxtics 2
set ylabel 'Population, %'
set ytics 1 out nomirror
set mytics 2
set samples (to - from + 1)
set style function impulses
plot [x = from:to] \
Pm(x) lw 2, \
Po(x) lw 2, \
Pe(x) lw 2
|
| 日期 | |
| 來源 | 自己的作品 |
| 作者 | Alessio Damato, Mikhail Ryazanov |
- ↑ Kaufman, A.S. (2009年) 《 IQ Testing 101》、New York (NY): Springer Publishing、pp. 104−109 ISBN: 978-0-8261-0629-2.
授權
我,本作品的著作權持有者,決定用以下授權條款發佈本作品:

|
已授權您依據自由軟體基金會發行的無固定段落、封面文字和封底文字GNU自由文件授權條款1.2版或任意後續版本,對本檔進行複製、傳播和/或修改。該協議的副本列在GNU自由文件授權條款中。 |
| 此檔案採用創用CC 姓名標示-相同方式分享 3.0 未在地化版本授權條款。 | ||
| ||
| 已新增授權條款標題至此檔案,作為GFDL授權更新的一部份。 |
您可以選擇您需要的授權條款。
檔案歷史
按到日期/時間去眵吖許時間有過嗰檔案。
| 日期/時間 | 縮圖 | 尺寸 | 用戶 | 說明 | |
|---|---|---|---|---|---|
| 眼前 | 2020年11月26日 (禮拜四) 23:11 | | 600 × 480(9 KB) | Paranaja | Reverted to version as of 21:27, 2 November 2012 (UTC) |
| 2012年11月2日 (禮拜五) 21:27 |  | 600 × 480(9 KB) | Mikhail Ryazanov | IQ values are now integers; gnuplot-only approach | |
| 2006年12月6日 (禮拜三) 09:20 |  | 600 × 480(12 KB) | Alejo2083 | {{Information |Description= The IQ test is made so that most of the people will score 100 and the distribution will have the shape of a Gaussian function, with a standard deviation of 15. The plot shows the percentage of people getting a score versus the |
檔案使用
冇頁面連結到箇隻檔案。
全域文件用途
以下其他 wiki 使用了這個檔案:
- ar.wikipedia.org 嗰使用狀況
- ast.wikipedia.org 嗰使用狀況
- az.wikipedia.org 嗰使用狀況
- ba.wikipedia.org 嗰使用狀況
- be-tarask.wikipedia.org 嗰使用狀況
- be.wikipedia.org 嗰使用狀況
- ca.wikipedia.org 嗰使用狀況
- cs.wikipedia.org 嗰使用狀況
- da.wikipedia.org 嗰使用狀況
- de.wikipedia.org 嗰使用狀況
- Intelligenzquotient
- Normwert
- Wikipedia:WikiProjekt Psychologie/Archiv
- Benutzer:SonniWP/Hochbegabung
- Kritik am Intelligenzbegriff
- The Bell Curve
- Benutzer:Rainbowfish/Bilder
- Quantitative Psychologie
- Intelligenzprofil
- Benutzer:LauM Architektur/Babel
- Benutzer:LauM Architektur/Babel/Überdurchschnittlicher IQ
- de.wikibooks.org 嗰使用狀況
- Elementarwissen medizinische Psychologie und medizinische Soziologie: Theoretisch-psychologische Grundlagen
- Elementarwissen medizinische Psychologie und medizinische Soziologie/ Druckversion
- Elementarwissen medizinische Psychologie und medizinische Soziologie/ Test
- Benutzer:OnkelDagobert:Wikilinks:Psychologie
- de.wikiversity.org 嗰使用狀況
- en.wikipedia.org 嗰使用狀況
- User:Michael Hardy
- User:Robinh
- User:Itsnotvalid
- User:M.e
- User:Quandaryus
- User:Astronouth7303
- User:Mattman723
- User:Iothiania
- User:Octalc0de
- Portal:Mathematics/Featured picture archive
- User:Dirknachbar
- User talk:BlaiseFEgan
- User:Albatross2147
- User:Klortho
- User:Kvasir
- User:Spellcheck
- User:Heptadecagram
- User:Patrick1982
- User:NeonMerlin/boxes
- User:Cswrye
檢視此檔案的更多全域使用狀況。