
文檔:World map of prehistoric human migrations.jpg
原始文件 (889 × 635 像素,檔案大細:274 KB ,MIME類型:image/jpeg)

|
本圖片是以PNG、GIF或JPEG格式上傳。然而,其中包含的資料或訊息,應該重新建立成可縮放向量圖形(SVG)檔案,以更有效率或更準確的方式儲存。如有可能,請上傳本圖片的SVG格式版本。在上傳之後,請修改維基各姊妹計畫中所有使用舊版圖片的條目(列在圖像連結章節中),替換為新版圖片,並在舊圖片的描述頁中加入{{Vector version available|新圖片名稱.svg}}模板,同時移除本模板。
|


摘要
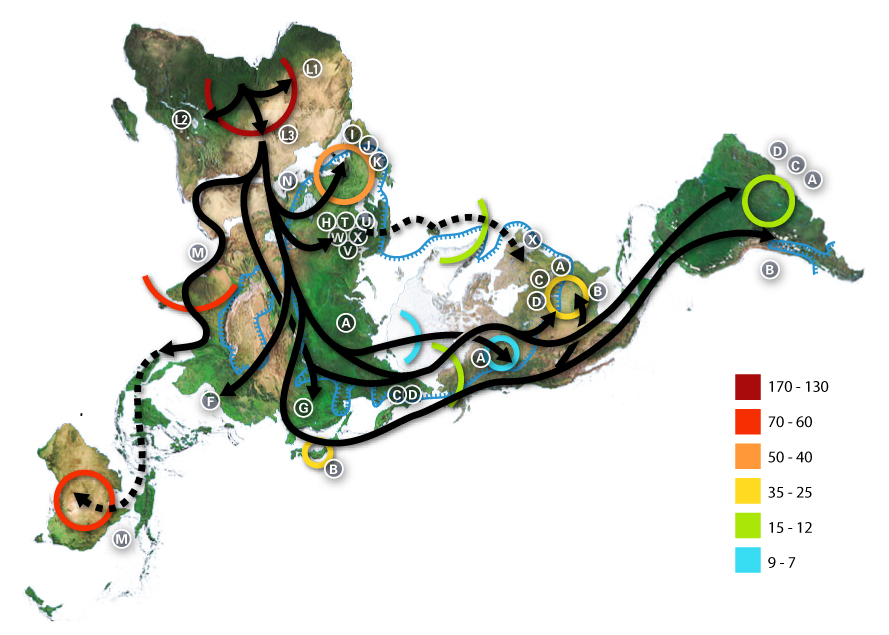
World map of human migrations, with the North Pole at center. Made in 2005.
Africa, harboring the start of the migration, is at the top left and South America at the far right. Migration patterns are based on studies of mitochondrial (matrilinear) DNA. Dashed lines are hypothetical migrations.
Numbers represent thousand years before present.
The blue line represents area covered in ice or tundra during the last great ice age.
The letters are the mitochondrial DNA haplogroups (pure motherly lineages); Haplogroups can be used to define genetic populations and are often geographically oriented. For example, the following are common divisions for mtDNA haplogroups:
- African: L, L1, L2, L3
- Near Eastern: J, N
- Southern European: J, K
- General European: H, V
- Northern European: T, U, X
- Asian: A, B, C, D, E, F, G (note: M is composed of C, D, E, and G)
- Native American: A, B, C, D, and sometimes X
- The letters I, J, K shown in Europe are apparently included by mistake, as they refer to Y-DNA haplogroups.
The dashed path for X, stopping in Iceland, gestures at the "Solutrean hypothesis", an idea discussed in the popular media at the time the map was made but mostly discredited since.
Data derivation
- Image:Northern icesheet hg.png shows the region that was covered by ice or tundra in the last ice age
- All migration data based on mitomap.
- Geographic data from File:Last glacial vegetation map.png
- and adding the following data File:Ice Age Temperature.png we get this interesting result File:Human-migration-temperature.jpg
Licenses

|
已授權您依據自由軟體基金會發行的無固定段落、封面文字和封底文字GNU自由文件授權條款1.2版或任意後續版本,對本檔進行複製、傳播和/或修改。該協議的副本列在GNU自由文件授權條款中。 |
| 此檔案採用創用CC 姓名標示-相同方式分享 3.0 未在地化版本授權條款。 | ||
| ||
| 已新增授權條款標題至此檔案,作為GFDL授權更新的一部份。 |
- 您可以自由:
- 分享 – 複製、發佈和傳播本作品
- 重新修改 – 創作演繹作品
- 惟需遵照下列條件:
- 姓名標示 – 您必須指名出正確的製作者,和提供授權條款的連結,以及表示是否有對內容上做出變更。您可以用任何合理的方式來行動,但不得以任何方式表明授權條款是對您許可或是由您所使用。
- 相同方式分享 – 如果您利用本素材進行再混合、轉換或創作,您必須基於如同原先的相同或兼容的條款,來分布您的貢獻成品。
檔案歷史
按到日期/時間去眵吖許時間有過嗰檔案。
| 日期/時間 | 縮圖 | 尺寸 | 用戶 | 說明 | |
|---|---|---|---|---|---|
| 眼前 | 2015年7月2日 (禮拜四) 01:54 | | 889 × 635(274 KB) | Chronus | Reverted to version as of 03:10, 22 May 2012 |
| 2015年6月24日 (禮拜三) 18:00 |  | 632 × 889(295 KB) | SteinsplitterBot | Bot: Image rotated by 90° | |
| 2012年5月22日 (禮拜二) 03:10 |  | 889 × 635(274 KB) | 84user | Reverted to version as of 19:10, 12 August 2005 | |
| 2012年5月20日 (禮拜天) 23:30 |  | 632 × 889(295 KB) | Rotatebot | Bot: Image rotated by 90° | |
| 2005年8月12日 (禮拜五) 19:10 |  | 889 × 635(274 KB) | Avsa | ||
| 2005年8月5日 (禮拜五) 21:05 |  | 536 × 380(80 KB) | Stevertigo (usurped) | reupload with similar changes, but without compression/artifacts | |
| 2005年8月5日 (禮拜五) 21:00 |  | 536 × 380(30 KB) | Stevertigo (usurped) | altered brightness contrast - black/brown blending was distracting in last version | |
| 2005年7月17日 (禮拜天) 20:30 |  | 536 × 380(110 KB) | Avsa | ||
| 2005年7月16日 (禮拜六) 18:08 |  | 745 × 380(99 KB) | Avsa | Map of human races migration, according to the mithocondrial dna. All data based on mitomap http://www.mitomap.org/WorldMigrations.pdf I ignored all data I could not understand (for example a dotted line, the +/- and the letters). If someone explains to | |
| 2005年7月16日 (禮拜六) 18:03 |  | 745 × 380(99 KB) | Avsa | Map of human races migration, according to the mithocondrial dna. All data based on mitomap http://www.mitomap.org/WorldMigrations.pdf I ignored all data I could not understand (for example a dotted line, the +/- and the letters). If someone explains to |
檔案使用
底下嗰1隻頁面連結到箇隻檔案:
全域文件用途
以下其他 wiki 使用了這個檔案:
- af.wikipedia.org 嗰使用狀況
- ar.wikipedia.org 嗰使用狀況
- ba.wikipedia.org 嗰使用狀況
- bn.wikipedia.org 嗰使用狀況
- bs.wikipedia.org 嗰使用狀況
- bxr.wikipedia.org 嗰使用狀況
- ca.wikipedia.org 嗰使用狀況
- cs.wikipedia.org 嗰使用狀況
- da.wikipedia.org 嗰使用狀況
- de.wikipedia.org 嗰使用狀況
- de.wikinews.org 嗰使用狀況
- de.wiktionary.org 嗰使用狀況
- en.wikipedia.org 嗰使用狀況
- Human evolution
- Wildlife
- Dymaxion map
- Talk:Human migration
- User:Avsa
- User talk:Truthteller
- Wikipedia:Reference desk/Archives/July 2005 II
- Genealogical DNA test
- User talk:Brian0918/Archive 07
- Haplogroup
- Talk:Human/Archive 16
- Haplogroup N (mtDNA)
- Haplogroup A (mtDNA)
- Haplogroup C (mtDNA)
- Haplogroup L3
- Human genetic variation
- Haplogroup Y
- Talk:Black people/Archive 11
- Portal:Maps/Maps/Thematic
- Portal:Maps/Maps/Thematic/1
檢視此檔案的更多全域使用狀況。